Belgium Day-Ahead Market: When Negative Prices Become the Norm
Published on 12 April 2026
Understanding how renewable saturation and demand patterns are reshaping price signals in the Belgian wholesale market.
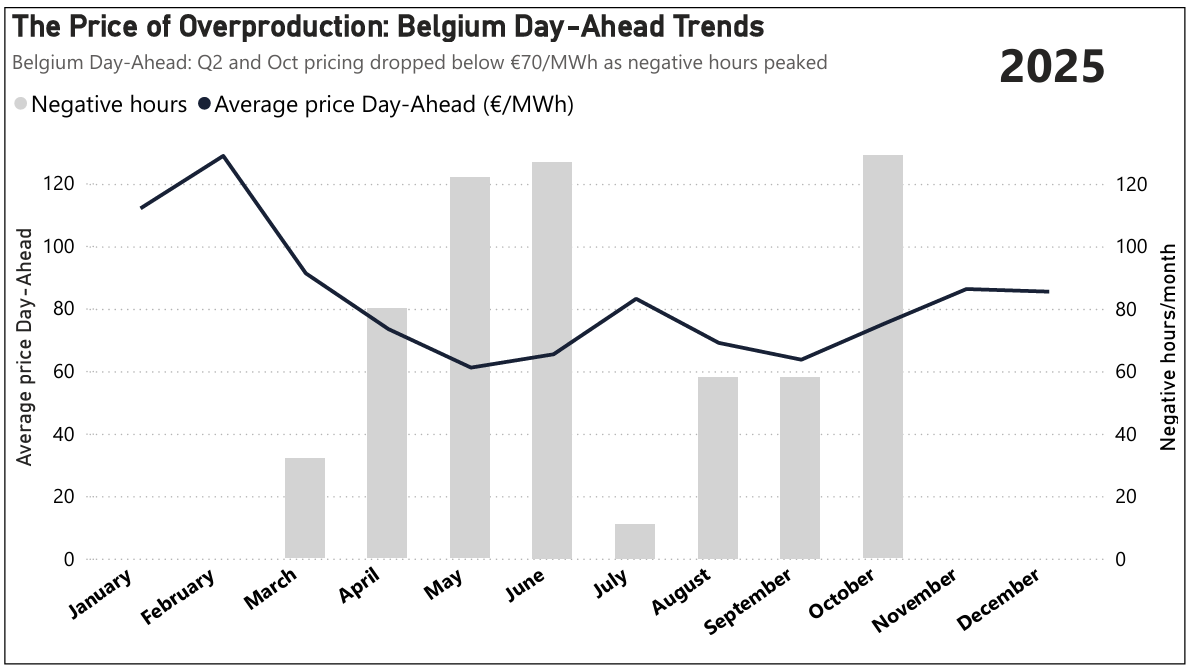
The Belgian Day-Ahead market recorded 617 hours of negative pricing in 2025, spread across 8 of the 12 calendar months. This is no longer an edge case. It is a structural feature of how the grid is operating today.
The pattern is predictable. Negative prices concentrate in the midday hours of spring and early summer, when solar generation peaks and consumption is moderate. June and October each exceeded 127 and 129 negative hours respectively. January and February recorded none.
What this tells us is simple: the grid is regularly receiving more energy than it can absorb, and the price signal reflects that imbalance in real time.
Data source: ENTSO-E
Same Day, Opposite Prices
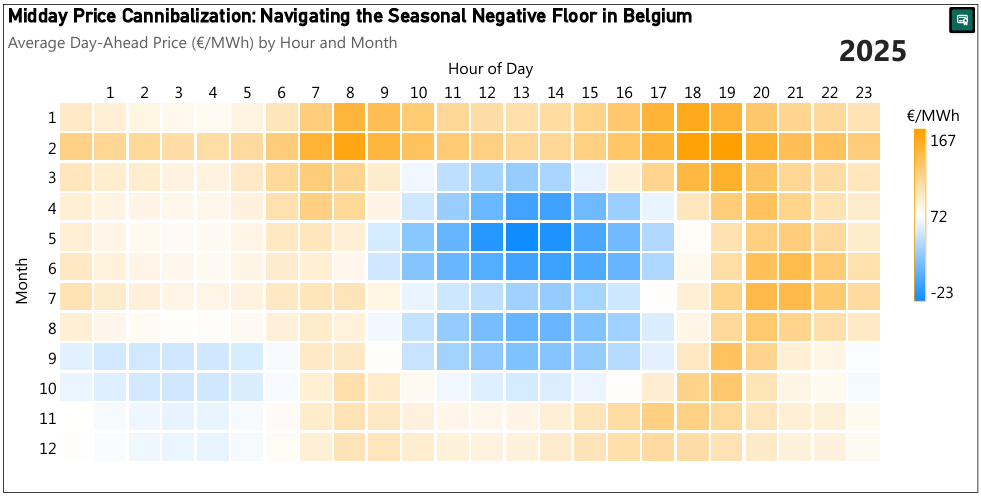
The more revealing story is intraday. In June 2025, the average price at midday sits near zero or below, while the same evening, between 20:00 and 22:00, prices average above 130 €/MWh. That is a swing of over 140 €/MWh resolved within eight hours, on the same grid, on the same day.
Winter months show a different structure entirely. November through February record no negative hours and stable double-peak profiles driven by heating demand, a fundamentally different market dynamic from the solar-dominated summer.
These two regimes do not average out. They coexist, and they require different strategies.
Data source: ENTSO-E
What This Means
Negative prices are not a problem for the grid in isolation; they are a signal. They indicate where flexibility is missing and where value is being destroyed by assets that cannot respond fast enough to what the market is asking.
The spread between midday troughs and evening peaks represents the economic case for flexibility. It is measurable, repeatable, and growing. The question is no longer whether the market needs flexible assets; it is whether the right assets are in place to capture what the price curve is already offering.
Key Takeaways
- Negative pricing is structural, not seasonal noise: 8 of 12 months affected in 2025
- The intraday spread is the opportunity: over 140 €/MWh between midday and evening in June
- Winter and summer are different markets: strategy needs to reflect both regimes
- Inflexibility has a cost: assets that cannot shift dispatch are exposed to the worst hours
Data Disclaimer: Market data sourced from the ENTSO-E Transparency Platform and processed independently by euGreenalytics. Provided for informational purposes only, not investment, trading, or commercial energy advice. Historical data does not predict future market behaviour. euGreenalytics is not affiliated with or endorsed by ENTSO-E or its member TSOs. Terms of Use · Data Sources