Five Months In: How Spring 2026 Reshaped European Power Prices
Published on 1 June 2026
From a winter near 100 €/MWh to a noon at effectively zero. The first five months of 2026 are now complete, and the data shows a market being pulled apart by solar in ways that are no longer seasonal noise.
January opened where winter always does: expensive. Gas set the marginal price, demand was high, and markets across Europe cleared well above 70 €/MWh. Germany reached 109 €/MWh. None of this was new.
February was different. Spain averaged 16 €/MWh for the entire month. Not for a single afternoon, but for the entire month of February, in the middle of winter. The driver was hydro: an exceptionally wet winter had filled Iberian reservoirs, and the surplus flooded the market at exactly the moment gas would normally dominate. North-western Europe saw none of it. The gap between Iberia and Germany that month was the widest in the dataset.
Three Markets, Three Personalities
From March onward, solar replaced hydro as the dominant driver of Iberian prices. April brought the seasonal floor across all markets. Then May reversed part of the descent, but not equally.
Germany rose sharply in May, driven by recovering demand and gas at the morning and evening margins. Spain also rose, but the gap with Germany remained wide. The most unexpected move came from France: in April, its monthly average fell below Spain, a market with substantially more solar capacity per unit of demand. Nuclear baseload combined with solar is producing Iberian-style price depressions in France. By May, France and Spain had converged almost exactly.
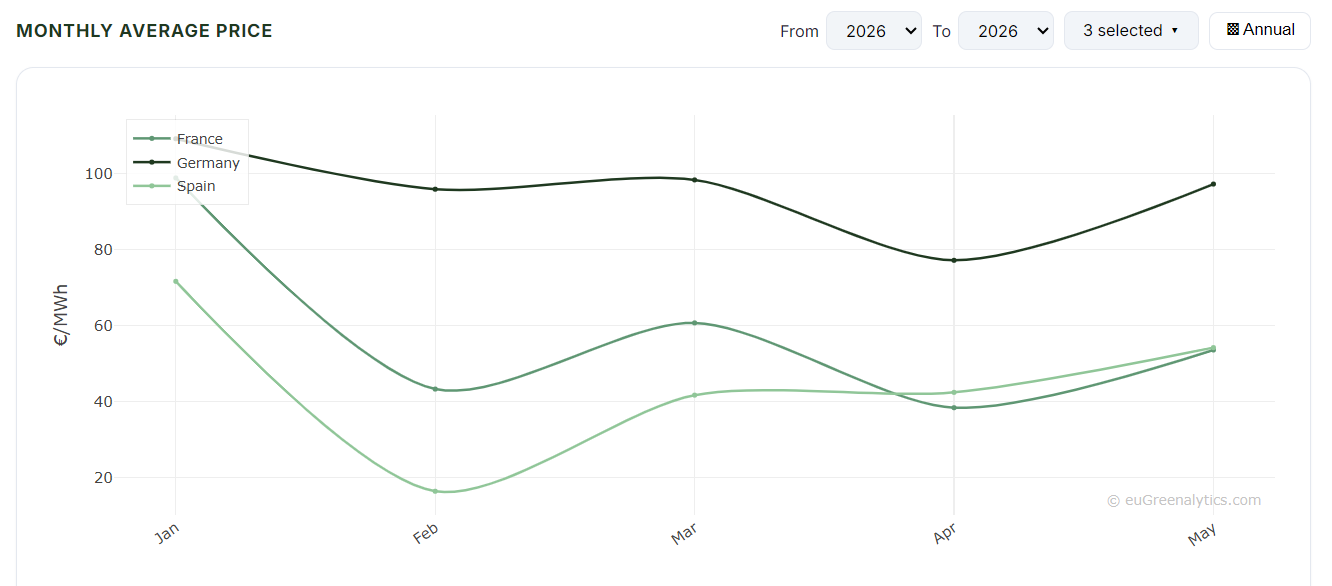
The chart is not just five months of prices. It is a record of three different generation mixes responding to the same seasonal calendar.
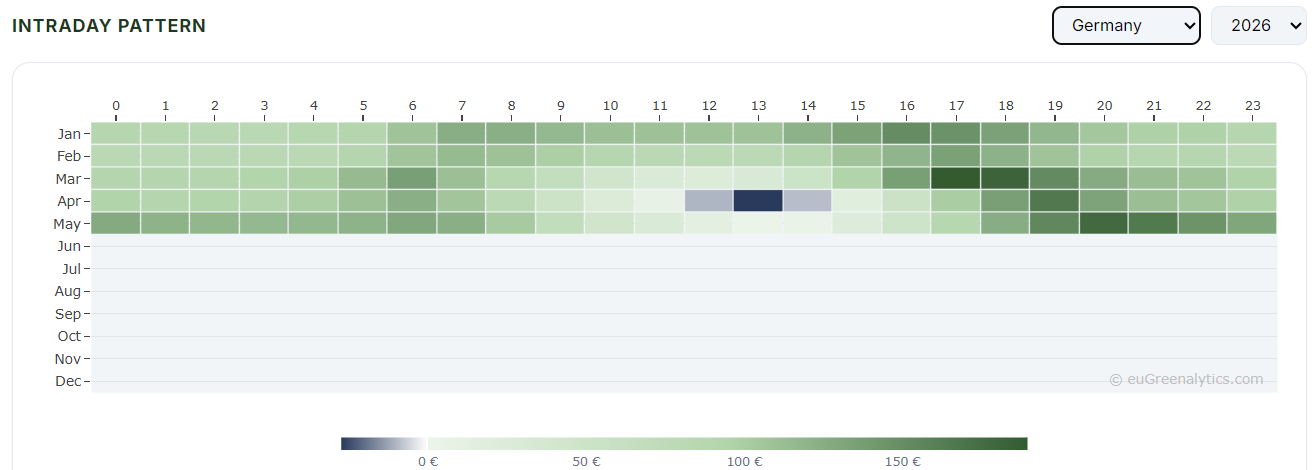
1 €/MWh at 13:00. 178 €/MWh at 20:00.
Monthly averages describe where prices went. The hourly profile explains why. Germany in May 2026 makes the point as clearly as any single chart can.
At midnight, Germany averaged above 125 €/MWh. Gas set the price, demand was running, there was no solar. By mid-morning, solar was ramping and prices were falling. By 13:00, the average clearing price for that hour across all 31 days of May had reached 1 €/MWh. Then the ramp: solar faded, demand held, gas returned. By 20:00, the average price peaked at 178 €/MWh. The spread between the cheapest and most expensive hour of the day averaged 177 €/MWh, every day, for a full month.
Data source: ENTSO-E A44
One detail in this chart is worth pausing on. In April, Germany's midday prices went negative: solar combined with reduced Easter demand pushed clearing prices below zero. May had more solar than April. Yet May's midday trough stayed just above zero. The reason is demand: the post-Easter return of industrial and commercial activity absorbed the additional generation and prevented prices from turning negative. More solar does not automatically mean lower prices. Demand is always the other half of the equation.
The Gap That Does Not Close
In February the gap between Iberia and north-western Europe was driven by hydro. In spring it was driven by solar. In May, both clusters rose, but Spain remained roughly 43 €/MWh below Germany. The gap has been present across almost every week of the five-month period. It shifts in magnitude but rarely in direction.
The explanation is structural, not seasonal. Iberia has more solar capacity per unit of demand than any other major European market, and limited interconnection to export the surplus northward. The market clears lower because the excess has nowhere to go. Without new interconnection investment, that constraint does not change.
The intraday spread is where these two realities meet. In Iberia and increasingly in France, the question is what captures value at midday. In Germany, the question is who is exposed when the 20:00 hour averages 178 €/MWh on a routine Tuesday in May.
What Summer Will Test
May marks the end of the transition. June will add more solar hours, higher generation peaks, and, depending on temperatures, higher evening demand. The midday floor may deepen further. The evening ramp may not.
The first five months have established the structure. A hydro anomaly, solar saturation, and a daily arbitrage spread that few markets have matched. What the data has not yet faced is summer: longer solar days, higher generation peaks, and the question of whether demand can keep pace at midday or whether the floor deepens further. That test starts now.
Key Takeaways
- Spain averaged 16 €/MWh in February: a full-month average in winter, driven entirely by hydro, not solar
- France fell below Spain in April: nuclear plus solar pushed France's monthly average below Iberia's for the first time
- Germany's daily spread averaged 177 €/MWh in May: from 1 €/MWh at 13:00 to 178 €/MWh at 20:00, every day, on average
- More solar in May did not mean lower midday prices than April: post-Easter demand absorbed the additional generation; demand is always the other half of the equation
- The Iberian discount is structural: 43 €/MWh below Germany in May, driven by solar capacity and interconnection limits, not weather
Data Disclaimer: Market data sourced from the ENTSO-E Transparency Platform (A44) and OMIE, processed independently by euGreenalytics. Provided for informational purposes only, not investment, trading, or commercial energy advice. Historical data does not predict future market behaviour. euGreenalytics is not affiliated with or endorsed by ENTSO-E, OMIE, or any other data source referenced. Terms of Use · Data Sources