France: From Europe's Most Expensive Power Market to One of Its Cheapest
Published on 24 June 2026
Few repricings in European power have been as complete as France's. The market that set the continent's price ceiling at 276 €/MWh in 2022 now anchors its floor at 57 €/MWh, below every northern neighbour.
The 2022 peak measured lost supply, not a price level
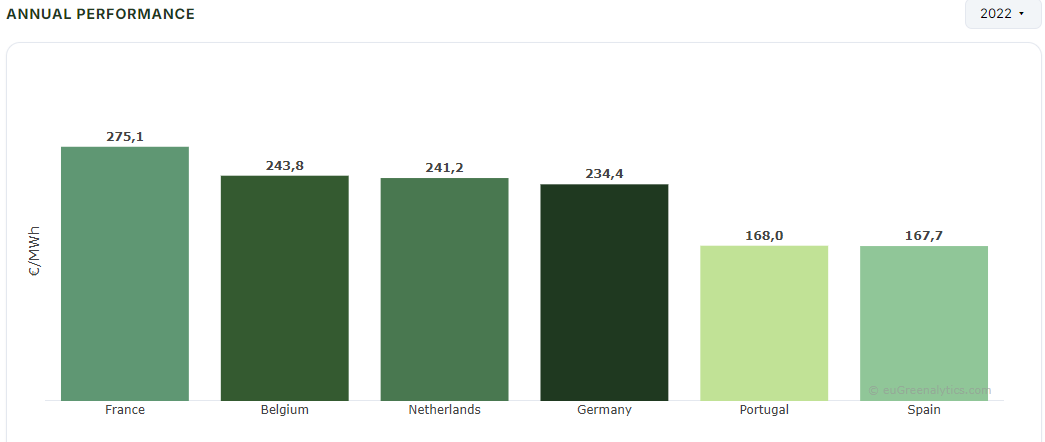
In 2022 the French day-ahead price averaged 276 €/MWh, higher than any other monitored market: above Belgium at 245 €/MWh, the Netherlands at 242 €/MWh and Germany at 235 €/MWh. That ranking was itself the anomaly. France is structurally a low-cost, nuclear-heavy exporter, yet with much of its reactor fleet offline for corrosion inspections it was importing at the worst possible moment, paying more than the gas-dependent markets it normally undercuts. Read the 276 not as France's level but as the cost of losing its baseload.
France now prices like the south, not the north it borders
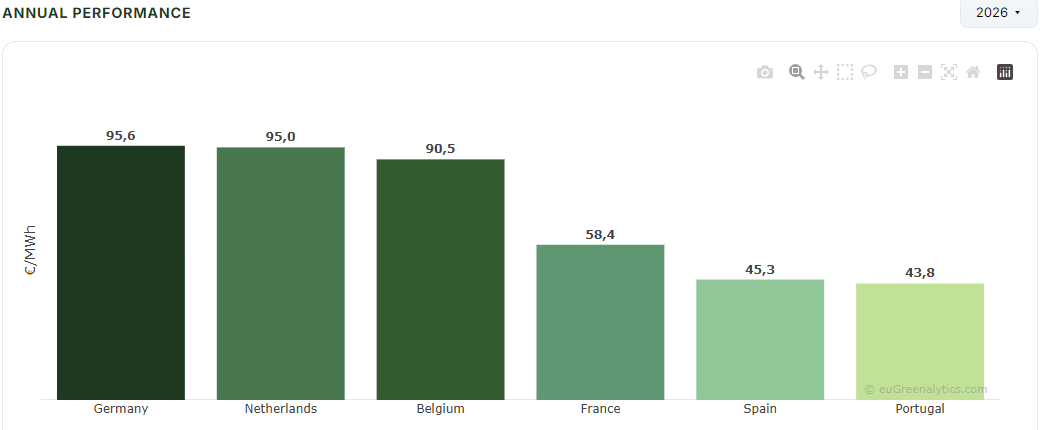
So far in 2026 France averages 57 €/MWh, 39 €/MWh below Germany at 96 €/MWh and cheaper than every northern market. The revealing comparison is not with its neighbours but with Iberia: France at 57 €/MWh now sits far closer to Portugal at 45 €/MWh and Spain at 46 €/MWh than to the German, Dutch or Belgian markets it physically borders. A market in the electrical centre of north-west Europe is clearing like the cheap, low-carbon periphery. The expensive-market label did not disappear. It moved across the border to Germany.
The swing is larger than the entire price of a cheap market
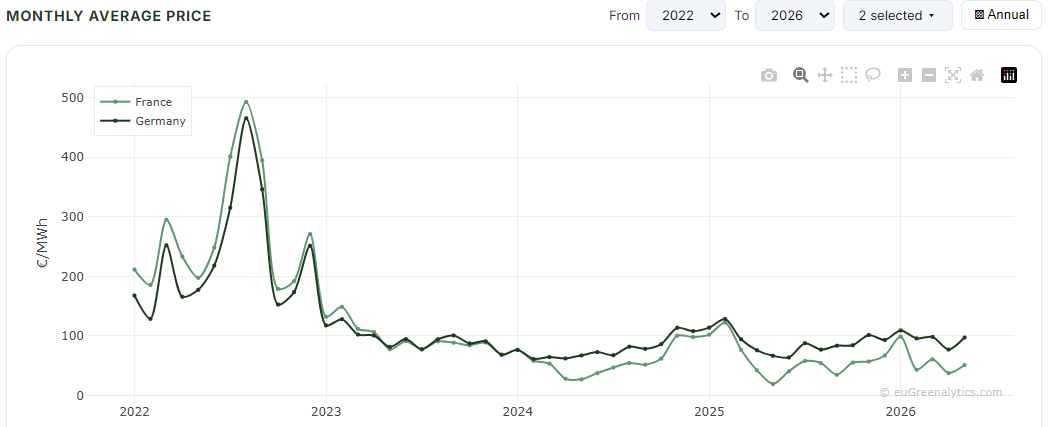
France first fell below Germany in 2024, at 58 €/MWh against 78 €/MWh, and has undercut it every year since. Measured against Germany, France has swung from 41 €/MWh above in 2022 to 39 €/MWh below in 2026, a relative move of 80 €/MWh. That swing exceeds the entire current price of Iberia: the repositioning between two neighbouring markets is greater than the level at which the cheapest markets in Europe now clear. France and Germany have traded places as the region's price anchor, low-carbon baseload pulling one down as gas holds the other up.
Key Takeaways
- France's 2022 peak (276 €/MWh, dearest of the six monitored markets) measured a supply shock, not a normal price.
- By 2026 France (57 €/MWh) prices closer to Iberia, Portugal at 45 €/MWh and Spain at 46 €/MWh, than to the northern markets it borders.
- The shift is structural, not weather: France crossed below Germany in 2024 (58 €/MWh against 78 €/MWh) and has stayed cheaper since.
- The relative swing against Germany, 80 €/MWh, runs from 41 €/MWh above in 2022 to 39 €/MWh below in 2026, larger than the entire current price of the cheapest European markets.
Data Disclaimer: Market data sourced from the ENTSO-E Transparency Platform (A44), OMIE and Energy Charts, processed independently by euGreenalytics. Provided for informational purposes only, not investment, trading, or commercial energy advice. Historical data does not predict future market behaviour. euGreenalytics is not affiliated with or endorsed by ENTSO-E, OMIE, Energy Charts, or any other data source referenced. Terms of Use · Data Sources